 day 61
|
behind apple's blunder 3: below the curve
by Philip Machanick
|
|
Yesterday, we learned how Apple could have
expanded its market share. Instead, the company failed to take advantage of its technology. Apple's failure to exploit their advantage left the company with half a billion dollars in unsalable stock. Could this have been foreseen?
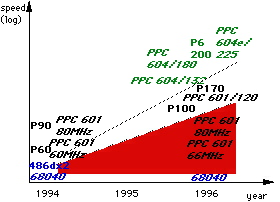
The graph (see figure) shows the performance trends. Generally, for a given price, you can buy double the performance every 12 to 18 months. This trend has been consistent since RISC microprocessors appeared in the mid-80s. The graph shows lines representing the low end and the high end, on a log scale, with some processor names suggestively positioned to show trends. (I don't intend the scale to be accurate -- otherwise the writing wouldn't fit in.) The graph clearly shows that the performance of Apple's low-end machines dropped well below the curve by late 1995. Their 68040 models, although still respectable performers, appeared to be overpriced in the eyes of year-end buyers who saw "Pentium 100" on similarly-priced PCs. Worse, most of the PowerMac line had also fallen below the curve. The red wedge in the figure represents half a billion dollars in stock write-offs. Why did this happen? Could it have been avoided? Details tomorrow. |
behind apple's blunder
 1
2 1
2
 Daily Dose Index |